Back in university, I took a course on graphs. By that I mean collections of vertices (representing entities) linked by edges (representing relationships). They are a fascinating area of mathematics and theoretical computer science. What is even more fascinating is how they can be applied to analysing and reasoning about a myriad of interesting natural and artificial systems. Notable applications range from the prediction of how infections spread in communities, the design of more resilient computer networks, or the most efficient way to cross seven bridges in Prussia.
I’m a little bit obsessed with graphs, and one day I will write a dedicated post about how to add them as a surprisingly effective tool in your data science belt. In truth however, graphs cannot be applied to just any problem (even though they are under-utilised in my experience). Instead, this is a post reflecting about three principles that I believe to be universal nuggets of wisdom - and I first started thinking about each of them while completing the final project for this one course. I should probably have bought my professor some flowers at the time.
What I was trying to do
In 2019, in hindsight a time of great innocence, people were obsessed with fake news and the impact they were having on public discourse. Computer scientists, eager as ever to design algorithms that would magic away era-defining sociocultural and geopolitical problems, jumped on it and looked at whether techniques based on machine learning and natural language processing could help.
I, ever the conformist, thought it was an excellent topic to try and explore. However, I wasn’t interested in finding linguistic indicators for lies - after all, as Tom Scott eloquently points out, there can be no algorithm for truth. Instead, I designed a graph algorithm to learn from the dynamics of spread of manually identified falsehood.
So I downloaded FakeNewsNet, a dataset of labelled truthful and fake news articles together with identifiers for tweets that shared them (remember Twitter?). Then, I used Twitter’s free and open API (LOL) to download the social graph of everyone who retweeted those articles.
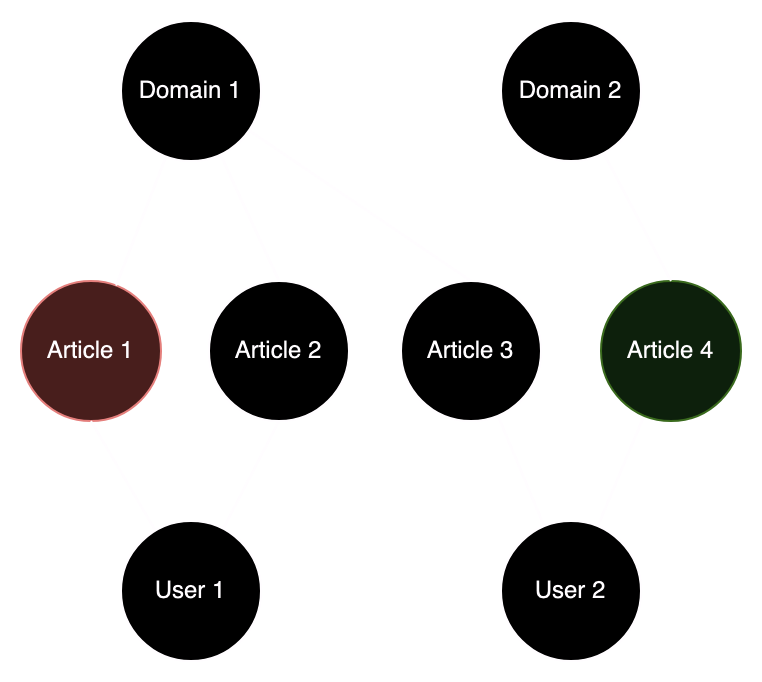
I modelled users, articles and web domains as vertices. An edge connected:
- Articles to the web domains on which they were published
- Users to the articles they re-shared
I had the ground truth of whether each article was truthful or fake, manually labelled by humans. I hypothesised that with a small “initialisation set” of articles with their label, we could reconstruct some of the other “censored” labels, by transferring across the graph information on the trustworthiness of each node.
Users would be assigned a trustworthiness score based on how many truthful vs. fake articles from the initialisation set they had tweeted. A portion of this score would be transferred to all other articles they had tweeted (the un-initialised ones, considered to be unlabelled for the sake of the experiment). The same would happen to web domains: they would have a score initially based on which labelled articles they were connected to, and would pass this score on to their other articles. Each article in turn, would communicate their degree of trustworthiness to other users and web domains. We can keep passing this signal around and compute scores for each node X based on the average score of the nodes connected to X. Eventually the scores for each node stabilise and we stop the algorithm. Then, we look at the scores of the previously unlabelled articles. We can decide a threshold at which we declare an article to be probably false, or perhaps more usefully, rank articles based on their score, and then manually verify each with whatever limited human resources we have available.
One: let your model sprout from domain knowledge
If you traveled back to the noughties and opened a textbook on natural language processing (NLP), you would learn about a bunch of linguistic subject matter: parsing morphology, specifying grammars, building syntax trees. Only a few years later a lot of this would lose relevance as deep learning came to dominate completely not just the field of NLP, but most of AI research. This is the “bitter lesson”. More recently still, we have come to the astounding conclusion that we can achieve state of the art results in completely different domains, ranging from speech recognition, to object detection, and machine translation, using a single neural architecture: the transformer. NLP practitioners don’t need to learn as much as they used to about the nature and rules of human language; instead they can focus on how to make neural networks learn more quickly, more cheaply, and more robustly.
At the same time, AutoML tools have gained traction, promising to automate the whole pipeline including data cleaning, feature engineering, model construction and selection. You give them a dataset and a target, they come back with a best-performing model.
These two trends can partly explain why the mainstream discourse about machine learning is so concentrated around data, models and learning algorithms, and doesn’t focus so much on problem framing or the integration of human expertise in models. This leads to a rather limiting idea of what the job is. I don’t dispute the important lessons the field has learnt, but I think we can find a slightly better balance between empiricism and rationalism in data science work.
I’ll start by saying that unless you’re dealing with complex modalities like audio, video or images, and text, you don’t strictly need deep learning. Across tabular prediction tasks, combinatorial graph problems, and recommender systems, simpler models have comparable or better performance than their neural counterparts, and are easier to implement and to explain (in terms of what they learn).
And here’s some bad news: some feature engineering may be required. Even deep learning can’t learn useful “concepts” if they are built on contextual information you don’t include, and you can’t possibly attach the full state of the world to every training sample. However, you can use what you know about the problem to make sure you include at least a few highly relevant slices of the world.
Even if useful features could theoretically be reconstructed, injecting some opinions into your model based on accumulated expertise can complement the data-driven element and give the model a huge head start. This is especially true if you’re not a big consumer company, as chances are you’re going to have at least some problems for which you don’t have enormous quantities of data. Or if you do have lots of data, it might not exhibit the right distribution. For example, you might be aware of some significant pattern shift and want to tell your model how to deal with it. If your model is knocked out by data drift, it might be impractical to wait until you have collected enough new samples to revive it.
Many organisations became painfully aware of this issue when COVID hit. At that time I was helping one of those big consumer companies predict call volumes to their help centres. Historically, they had relied on traditional time series analysis. Now, historical “dumb” patterns were useless, but the company needed some way of estimating what was about to hit them (I’ll just say they operated in the travel sector). The solution was building a customer journey model. We knew who had already purchased a holiday, and we could estimate their propensity to call (and when) based on customer characteristics. Turns out, some patterns in customer behaviours didn’t shift too much because of COVID, and we could estimate behavioural differences by injecting into the model information on current events, e.g. national lockdown levels or R numbers.
Another useful consideration is that not all data science tasks are prediction tasks. We all have been brainwashed to believe that, but in fact most tasks are about informing decisions, which means: we need to model the effect of our actions so we can choose what to do. Without this angle, we risk intervening on the world, messing up the patterns our model had picked up on, and render its predictions quite useless. To understand the effect of interventions we need to tell the model the direction of the causal relationship between pairs of variables. We can learn this experimentally, or use previous domain knowledge, but it is provably impossible to lean exclusively on observational data1.
Finally, models that incorporate variables inspired by prior knowledge often learn other useful quantities as a side effect. We can reuse them for model debugging, for generating more insight, or for other adjacent tasks. In the case of the fake news graph, we might decide to look at the scores of users and ban some of them altogether, instead of playing an infinite game of whack-a-mole.
Back to fake news classification. I had to deliver the project for a course about graphs, so I had a solution in search of a problem. Would I have used a similar approach if things were flipped? Many blogs and online communities suggested tackling the problem with NLP approaches, unsurprisingly. NLP was hot, and it followed the formula described above: mindless input of data + state of the art neural network = $$$. In order to land on my approach you would have had to think about what information we know a priori to be useful for estimating the reliability of an article. Other than superficial markers, it’s not the content, unless you build a model of the world that contains facts and lies and you compare articles against that. But this is demanding, unlikely to be robust, and fundamentally a reactive approach. The alternative is trust. We build trust around other entities that will “vouch” for a news story by giving it visibility. What kind of entities? Users, and websites.
A few hypothesis start to emerge. In order for the graph algorithm to work, we need to assume that:
- Some users are more prone than average to share fake news, ranging from the slightly gullible all the way to the malicious bot. Similarly, domains have characteristic probabilities2 of sharing fake news. For users and domains, we can learn how likely they are to share fake news provided we have enough labelled articles directly connected to them
- Given a reliable estimate of the trustworthiness of users and domains, we can estimate with enough reliability how likely it is that the unlabelled articles they shared are fake
- Putting this all together: given a large enough initialisation set, there is enough signal moving around the graph to allow us to label all news stories with an acceptable level of accuracy
Designing this model requires thinking about the problem, making some assumptions about what is the strongest source of signal (I posit: trust) and thinking about how we can transmit it to our unlabelled entities. In this case, by leveraging a graph.
Two: think in linear algebra
A lot of data science code can be mapped to operations on vectors and matrices. Some examples:
- Feature engineering on large collections of numerical data
- Estimating probability distributions from data and multiplying distributions, for example in the context of Bayesian inference
- Dimensionality reduction using techniques like PCA
- Applying matrix factorisation to power recommender systems
- Computing all pair-wise distances between points in a geometric space, as done for instance by the string_grouper Python package for fuzzy matching
- Training neural networks through back-propagation and using them for prediction
Applications like these would typically not be feasible with large enough data in languages such as Python or R. Hence, the implementation of algorithms as linear algebra operations is not a conceptual nice-to-have, it’s a computational necessity.
As it turns out, my iterative graph algorithm could also be expressed as operations on vectors and matrices. I used a vector to record the untrustworthiness scores for each vertex in the graph, and an adjacency matrix to represent the structure of the graph (by putting 1s to represent edges between two vertices, and 0s everywhere else). Multiplying the adjancency matrix by the score vector is equivalent to distributing the score signal along the edges of the graph and then summing all incoming signal that each vertex receives, thus obtaining an updated score vector ready for the next iteration.
To continue on the previous example, we order nodes in the graph above left-to-right and top-to-bottom, thus assigning to each an index (or position) within the score vectors and adjacency matrix. Then we compute the raw signal aggregation at each node after the first iteration (\(s^*_1\)) as the product between the (fixed) adjacency matrix, and the initialisation scores (for illustration we set uninitialised nodes to 0.5):
\[s^*_1 = \begin{bmatrix} 0 & 0 & 1 & 1 & 1 & 0 & 0 & 0\\ 0 & 0 & 0 & 0 & 0 & 1 & 0 & 0\\ 1 & 0 & 0 & 0 & 0 & 0 & 1 & 0\\ 1 & 0 & 0 & 0 & 0 & 0 & 1 & 0\\ 1 & 0 & 0 & 0 & 0 & 0 & 0 & 1\\ 0 & 1 & 0 & 0 & 0 & 0 & 0 & 1\\ 0 & 0 & 1 & 1 & 0 & 0 & 0 & 0\\ 0 & 0 & 0 & 0 & 1 & 1 & 0 & 0\\ \end{bmatrix} \begin{bmatrix} 0.5 \\ 0.5 \\ 1 \\ 0.5 \\ 0.5 \\ 0 \\ 0.5 \\ 0.5 \\ \end{bmatrix}\]Other aspects of the algorithm too were simple linear algebra operations, like normalising vectors so all their entries sum to 1, or calculating the magnitude of the difference of the scores between iterations so we knew when to stop.
There was an alternative implementation, one where at each iteration we loop over every node, and for every node we loop over every edge, collect the scores and aggregate them. While relatively simple to implement, I doubt my coursework would have been handed in in time, had I gone down that route.
Regardless of what going through some recruitment processes might lead you to think, successful applied data scientists don’t need to be able to describe in detail multiple efficient sorting algorithms, nor do they need to keep on top of the details of the latest low-level matrix multiplication algorithm. However, they need to be confident designing custom prediction and inference routines based on theory, and articulating them in the language of linear algebra.
And even when you’re not implementing an algorithm from scratch, being a good friend of vectors and matrices and understanding their relationship to Euclidean spaces will fuel your intuition on methods implemented by others, and allow you to bend them to your will.
Three: model the end impact
One of the versions of the fake news classifier I implemented had very good performance; so good in fact that I spent the two days leading to the coursework deadline desperately looking for a mistake in my initialisation or evaluation that would invalidate the results. In the end, I convinced myself that under a specific set of conditions the algorithm is very effective. I might have stopped there and bathed in self-satisfaction but there was a nagging question that prevented me from doing so. What was the point of what I had done? Who, if anyone, could have concretely used my method and what would the impact have been?
One of the papers I referenced in my literature review had done something interesting: they hadn’t just stopped at computing precision and recall of their model. Instead, they had come up with a story where a coalition of debunkers go around a social network and try to optimise their limited time for the greatest possible impact. Why bother with that? Well for one thing, not all fake stories are the same. Some are completely preposterous, but not particularly viral.
There was a more interesting way to evaluate (and tune) the algorithm I had created: one that looked at how popular fake stories were. I started thinking about coming up with my own story: who could have used my method? At that time, the social media platforms themselves were ramping up their efforts to make their sites a bit less wild. They had complete control (moderated by their usage terms and the likes) over who was allowed to stay on the platform, and which posts were to be taken down. Their only problem was scale: you have orders of magnitude more users than moderators, so you need to use automation, or find a policy that optimises your manual verification efforts, or both.
So the story goes: imagine you’re Twitter’s verification team (may it rest in peace) and you have a limited budget of articles you can check so that you assign a label to them. Your goal is to minimise the number of users exposed to fake stories. Because you don’t know in advance the number of “spared users” you will gain by verifying an article (which might turn out to be truthful), you need to apply some approximate policy. That’s the framework under which I run the final evaluation of my algorithm, using the combined number of followers of all users who shared each story as a ballpark figure for “spared users”.
Simply ranking stories by their untrustworthiness score did not work well at all. Therefore, I implemented a correction to the policy where the number of potential spared users contributed to the ranking too. Results did improve, but in the end, I did not beat my baseline: simply ranking by followers, disregarding my score altogether. This meant a complete reversal of my initial conclusion on performance. Part of the problem is that false negatives were likely to have large potential audiences, due to the mixed signal feeding into their score.
I wasn’t excessively dispirited for a few reasons. Firstly, I was working with what was probably an unrealistically balanced dataset (exact same number of true and fake articles). Maybe, in a world were identifying fake news is more of a “needle in a haystack” problem, my method might suddenly have had an edge. There were also other assumptions about the spreading dynamics that might not have held in practice, and I could not have learnt about in any way other than actually working at Twitter. Also, my method didn’t need to be successful to get me a good grade, but being scrupolous with my implementation and evaluation did.
In the real world, you should try to learn from your users as much as you can about the final application of your work and what is known about the context or dynamics that will interact with it. Then you can better model your end impact, for example by running a simulation, or a small-scale experiment in production, or by explicitly changing a loss function to reflect business cost / gains more accurately. Thinking about the difference between this and performance in a completely abstract setting might save you from wasting a lot of effort on optimising for the wrong metric. And even better: save you from acquiring completely unearned confidence in how good your work is. This is the type of confidence that damages the world and can risk the reputation of you and your colleagues.
-
For a simple theoretical introduction to some of these issues I recommend Causal Inference in Statistics: A Primer. ↩
-
No probability theory is actually involved. This is just an attempt to explain the intuition using simple language. ↩